Diagnostics
Diagnostic tools for TilePlus
System Information
The Tools/TilePlus/System Info menu command opens UIElements inspector that has a multitude of instrumented data from various parts of the TilePlus system.
Please note that this window refreshes constantly, even in Play mode, but only when the window is visisble. Depending on what's being displayed it can even slow down your system in Play mode.
The image below shows a typical appearance:
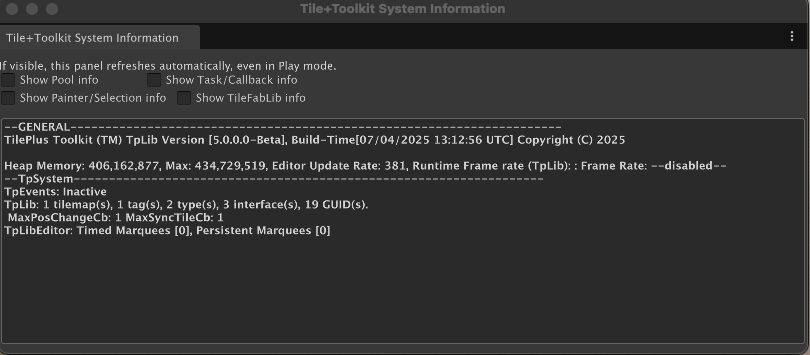
Each checkbox controls the display of additional information:
- Show Pool Info: status and size of TpLib internal pools.
- Show Task/Callback Info: status of TpLib's internal event/callback queues and what sort of Update (Awaitable or PlayerLoop) is in use.
- When checked, two more buttons appear:
- Details: a complete list of all of the running tasks. If there are a lot of them it can affect editor performance.
- Dump Tasks: the same information as Details is snapshotted and saved to a file. Works even if the Details checkbox is unchecked.
- When checked, two more buttons appear:
- Show Painter/Selection Info: internal state of TilePlus Painter.
- Show TileFabLib Info: internal state of the Layout system.
The info value in the task details section is set by the caller to TpLib.DelayedCallback. In this example, these info values have INV_REP prepended which means that the timer function InvokeRepeatingUntil was used. See the TpLib section for more info (near the bottom of the page).
Services Inspector
The Services Inspector is a UIElements-based window that can be opened with the Tools/TilePlus/Services Inspector menu item.
If you open this window in Unity's Edit mode it'll look empty. That's because Services (e.g., Tweener, Spawner, etc) don't run in Edit mode.
Here's an example of how it looks in Play mode for the Layout demo.
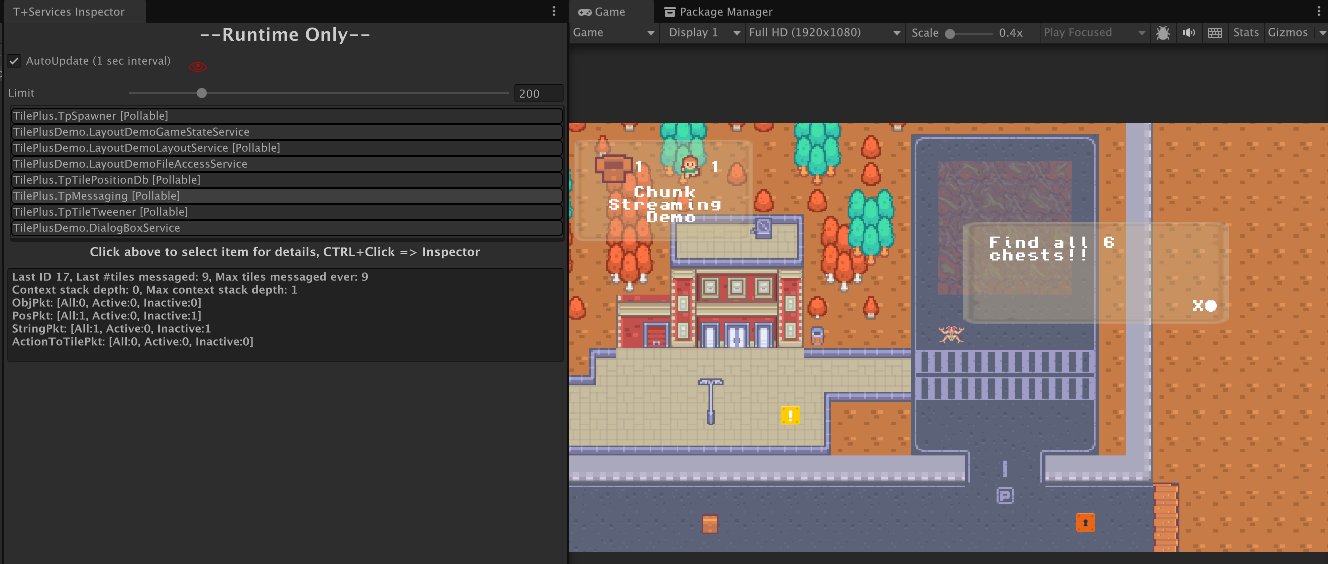
Note that the dialog box is open and the DialogBox service shows up in the list of Services. When you click the X button in the dialog you'd see the Dialog Box Service disappear.
That's because this tool automatically adds and deletes services from the list as they start running or are terminated.
The AutoUpdate checkbox auto-refreshes the details list every second.
The Limit slider can be used to limit how many lines appear in the bottom section of the window. Some services, the Tweener for example, can emit thousands of lines if you have many tweens running simultaneously.
[Pollable] on a services's line in the list means that the service can be polled for auto-refresh. Not all services support this: it's a design decision.
For example: here's the information shown by the LayoutDemo's Layout service:
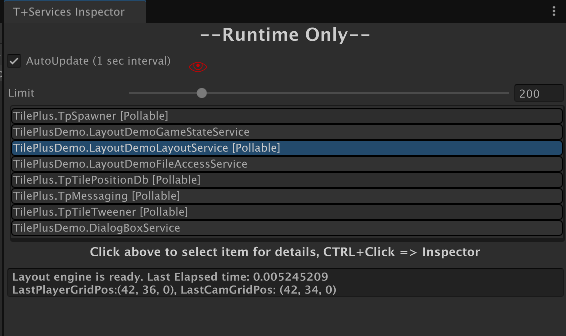
It just shows the most recent camera and Player positions as well as the elapsed time for the most recent Layout pass; about 5 mSec in this case.
This window is most useful when
- Debugging
- Developing new Services
Note that the text shown in the details section may not look exactly like what's shown in these images.
Tween Monitor
The Tween monitor displays information about all running tweens. It's handy to use when creating tweens because you can see every detail about the tween and its progress.
If there are many tweens running at the same time this window WILL affect performance and can cause stuttering.
Here's an example of a single tween:
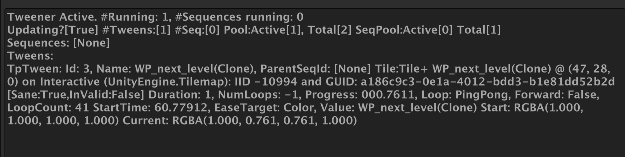
Basic Information about the Tweener itself includes:
- How many Tweens and Sequences are running.
- The size of the 'object' pools for Tweens and Sequences.
This is followed by a list of the 'ToString' methods of each Tween and Sequence.
Let's break up this Tween status string to see what it means:
-
Tween ID and the name of its parent TPT tile.
- If the name of a tween or sequence starts with
[GO]then it's a GameObject tween (or sequence) and not a TPT tile tween.
- If the name of a tween or sequence starts with
-
If the Tween is part of a sequence it's sequence ID is next.
-
The name, location, and Tilemap for the parent TPT tile and the tile's Instance ID and GUID.
-
Sanity Informaition: Sane means that the important variables haven't suddenly become null.
- A TPT tile can be deleted during a tween so this is important!
- Invalid true means that the tween is going to be deleted:
- It's complete
- It's become 'Unsane'
-
The Tween's Duration (how long it takes to complete)
-
How many loops.
-
The progress: ranges between 0 and 1.
-
What type of loop?
-
If Ping-Pong is the loop in the forward (ping) or backward (pong) part of the loop?
-
How many loops have completed.
-
What time the Tween started.
-
What's being tweened (EaseTarget)
-
Starting and current values
This is a lot of information but it's very structured and easy to understand after a while.
Position DB Dump
The command is not available unless the Editor is in Play mode.
The output is similar to what you'd see in the Services Inspector when viewing the Position DB service. That list can become longer than the 200 item maximum in the Services Inspector, so this command lets you see everything that the PositionDb is doing.
Here's an example 'dump':
TilePositionDB Data Dump on 7/5/2025 6:15:33 PM UTC, [DEBUG MODE? False]
[UpdateLimit:2147483647]
[QueueLen:0, PosHashSize:0]  [Num Maps:1]
Monitored Maps:

********Normal tiles *************************
********Tilemap: Tilemap***************************************
(12, -1, 0)
(13, -1, 0)
(14, -1, 0)
(12, 0, 0)
(13, 0, 0)
(14, 0, 0)
(12, 1, 0)
(13, 1, 0)
(14, 1, 0)
----->>>>>Total: 9<--------

********Enlarged sprites [9]********************************
Map: Tilemap, Position: (5, -1, 0) : Center: (5.50, -0.50, 0.00), Extents: (0.60, 0.60, 0.50)
Map: Tilemap, Position: (6, -1, 0) : Center: (6.50, -0.50, 0.00), Extents: (0.60, 0.60, 0.50)
Map: Tilemap, Position: (7, -1, 0) : Center: (7.50, -0.50, 0.00), Extents: (0.60, 0.60, 0.50)
Map: Tilemap, Position: (5, 0, 0) : Center: (5.50, 0.50, 0.00), Extents: (0.60, 0.60, 0.50)
Map: Tilemap, Position: (6, 0, 0) : Center: (6.50, 0.50, 0.00), Extents: (0.60, 0.60, 0.50)
Map: Tilemap, Position: (7, 0, 0) : Center: (7.50, 0.50, 0.00), Extents: (0.60, 0.60, 0.50)
Map: Tilemap, Position: (5, 1, 0) : Center: (5.50, 1.50, 0.00), Extents: (0.60, 0.60, 0.50)
Map: Tilemap, Position: (6, 1, 0) : Center: (6.50, 1.50, 0.00), Extents: (0.60, 0.60, 0.50)
Map: Tilemap, Position: (7, 1, 0) : Center: (7.50, 1.50, 0.00), Extents: (0.60, 0.60, 0.50)
As you can see, tiles with enlarged sprites are separate from those which have sprites of one unit or less.
- UpdateLimit is the # of positionDb updates per PositionDb update.
- If there are many tiles in the queue the update can take too long.
- The default is
int.MaxValue
- QueueLen and PosHashSize show the state of the updating queue.
- Recall that while tile deletions are handled immediately, additions are processed in the Services' Update method.
- This is followed by a list of Tilemaps:
- Each Tilemap entry shows
- Normal (scaled <= 1) tiles.
- Scaled (scaled > 1) tiles.
- Each Tilemap entry shows
Please see PositionDB for more information.